
Praxis Navigator: Risk Bearing
Know your true direction of travel — using your own data, not generic industry averages.
Your data. Your baseline. Your truth.
Industry benchmarks measure everyone else. Risk Bearing builds baselines from your own data.
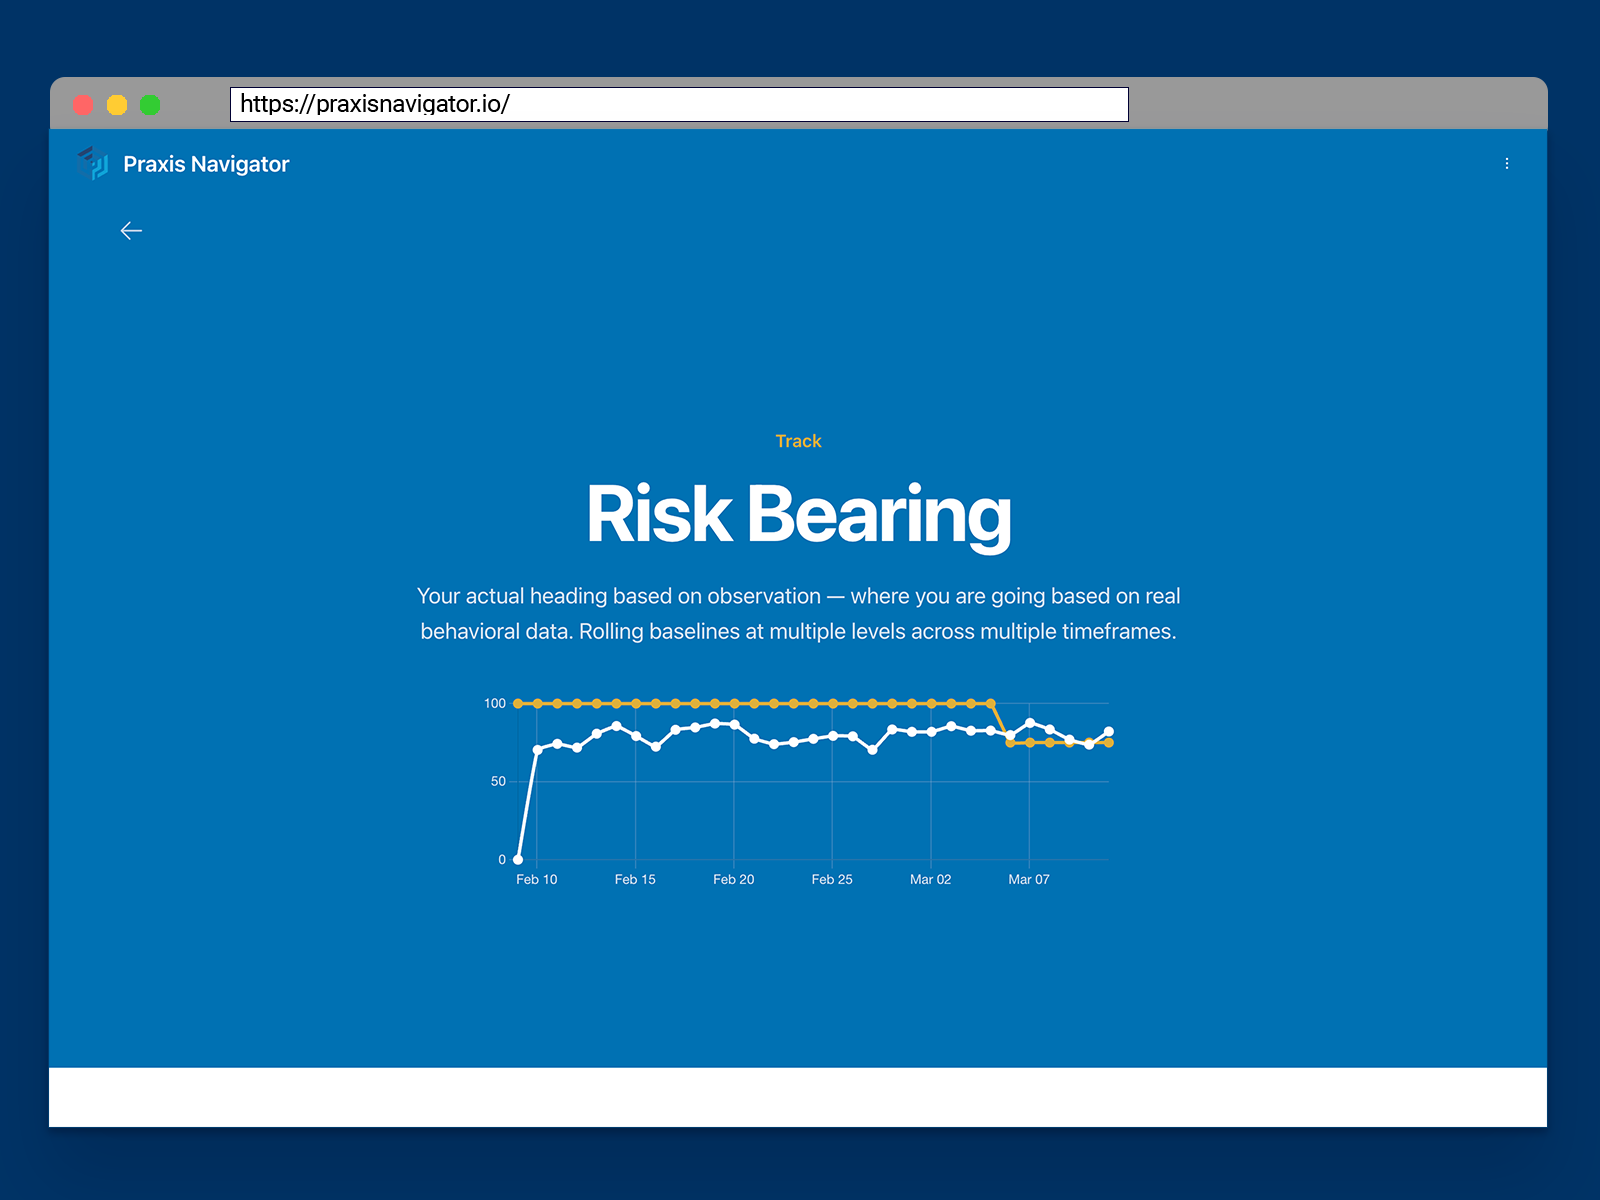
Direction-of-travel based on your own data
See at a glance whether your organization is heading in the right direction — based on real behavioral data, not industry averages.
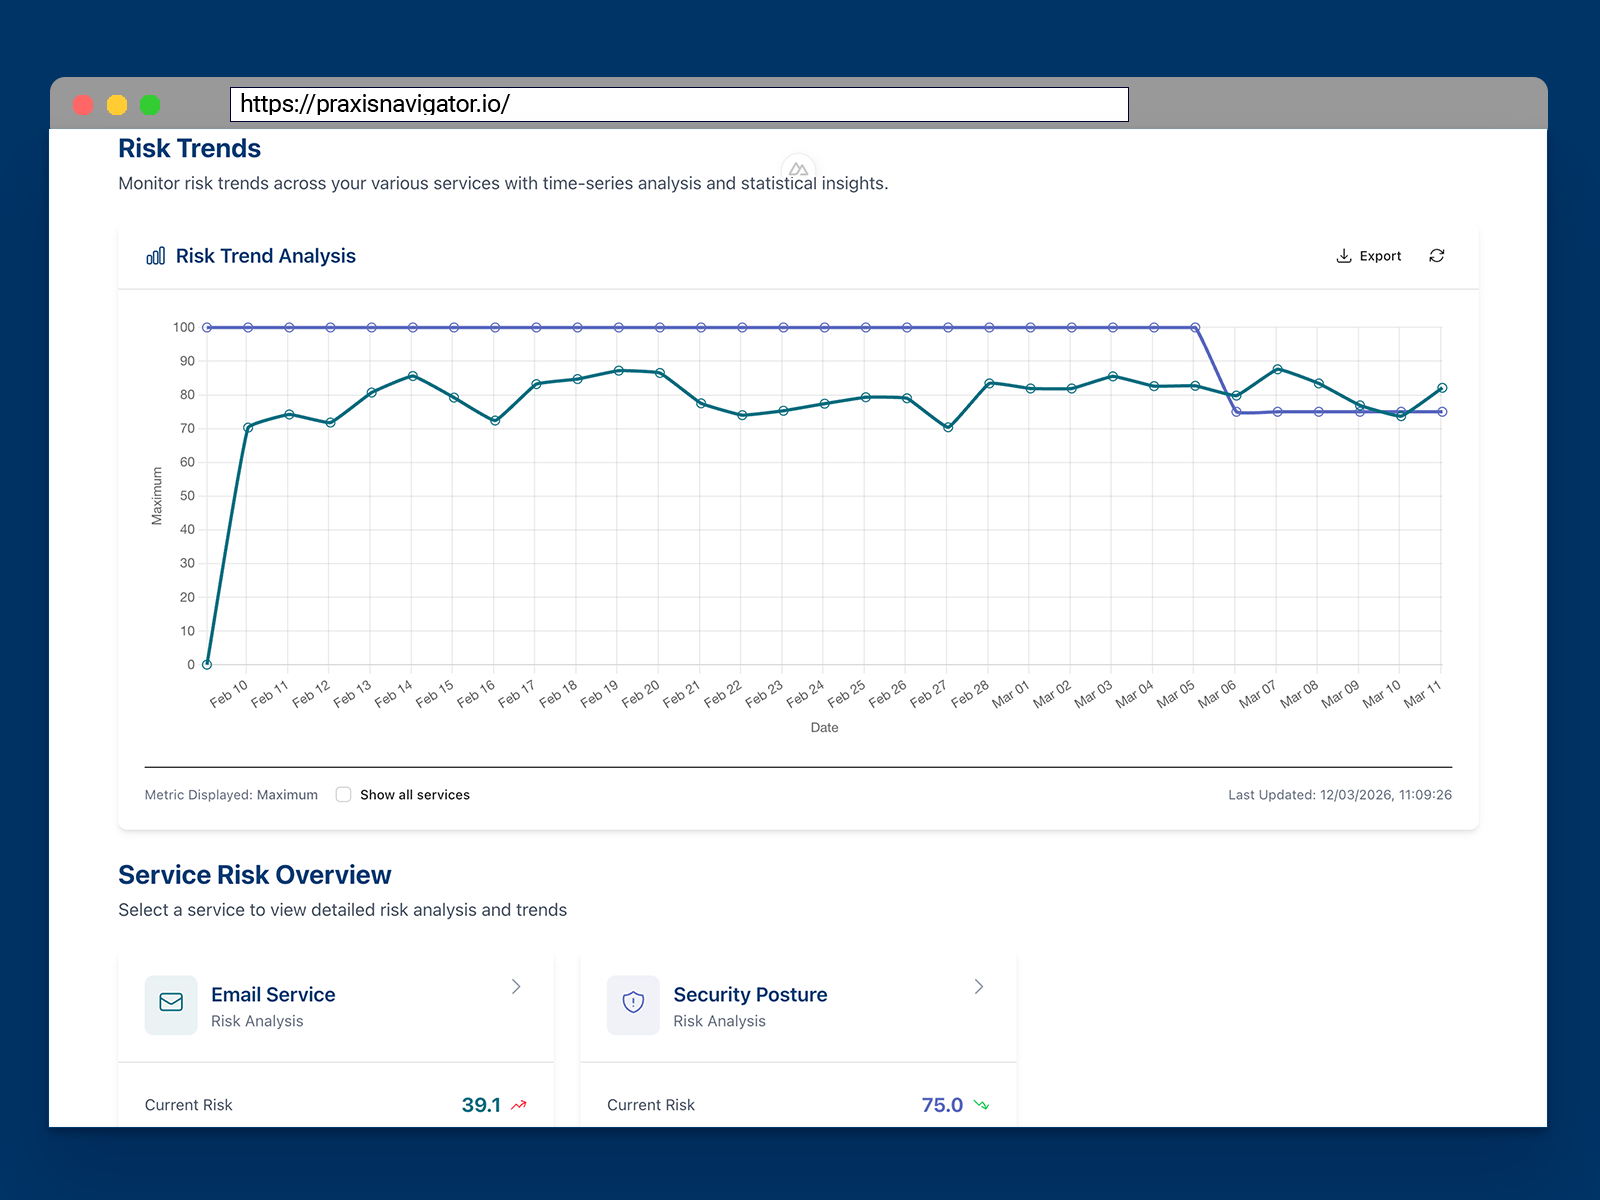
Multi-level baseline breakdown
Compare any team, department, or individual against their own historical baseline. See where improvement is happening and where it isn't.
Multi-Level Baselines
Baselines for individual employees, teams, departments, and the entire organization. Compare any level against its own history.
Multiple Timeframes
7-day, 30-day, quarterly, annual baselines. See short-term fluctuations and long-term trends. Understand what's noise and what's signal.
Baseline History
Not just current baselines — history of how your baselines have changed over time. See whether your baseline is improving, declining, or holding steady.
Day-One Baselines
Because Praxis Navigator pulls historic Microsoft data, your initial baseline is built from day one. You don't wait months to have something to compare against.
Get your own baseline in 15 minutes
Three simple steps to see what's happening with human security in your organization.
Connect your Microsoft 365 environment
Self-service wizard with read-only API access. No IT resources required beyond clicking "authorize." Available through Microsoft Marketplace — no sales calls, no demos, no procurement delays.
Setup time: 15 minutes
See your behavioral data immediately
Within 15 minutes, you see your organization's human security behaviors — including historic data reaching back months. Real baselines built from your own data, not generic industry benchmarks.
See patterns you couldn't see before
Prove what works with before/after evidence
Tag interventions (training, policy changes, new tools), see automatic before/during/after comparisons, and generate stakeholder reports that speak their language.
Complete the loop: Baseline → Intervention → Compare → Prove
“We didn't build another training platform. We built the proof layer that shows whether training — and every other intervention — actually works.”
— Kai Roer, CEO and Founder
Know where the risks are.
See your behavioral data — free for 30 days
Connect your Microsoft 365 and see months of employee behavior data you never knew existed. Get full access to all Praxis Navigator Core features for 30 days. No credit card required, no commitment.
- Full Core feature access for 30 days
- No credit card or payment required
- Deploy directly from Microsoft Marketplace
- See your data in 15 minutes
- Self-service setup — no sales call needed
- Cancel anytime during trial
Built for IT Leaders: Microsoft Graph API Integration | Privacy-focused data handling | Azure AD Authentication | EU data residency available
Quick Start
Azure Marketplace Integration