
Are You Getting More Secure — Or Just Hoping? How Internal Baselines Replace Industry Guesswork
Generic industry benchmarks do not tell you if your organization is improving. Risk Bearing builds rolling baselines from your own Microsoft 365 data — from day one.
It is annual review time. You pull up the security report from your SAT vendor and compare your organization against “industry benchmarks.” The numbers say you are above average. Leadership nods approvingly. Everyone moves on.
Here is what nobody asks: are you actually better than you were last quarter? Last month? Last week?
You do not know. The industry benchmark tells you how you compare against a collection of unknown organizations — different sizes, different industries, different maturity levels. It tells you nothing about whether your organization is moving in the right direction.
A snapshot without context is not a measurement. It is a guess dressed up as a metric.
The Industry Benchmark Trap
The security industry has normalized benchmarking against external data as if it were meaningful. Vendors publish annual reports with average phishing click rates, training completion percentages, and risk scores. IT leaders dutifully compare their numbers against these figures and report the results upward.
The problem is that these benchmarks are built from aggregated data across organizations that share almost nothing in common with yours. A 200-person logistics company in Northern Europe has fundamentally different risk patterns than a 5,000-person financial services firm in North America. Comparing them tells you as much as comparing your resting heart rate to an Olympic sprinter’s — technically a number, practically useless.
What actually matters is a different question entirely: relative to yourself, are you improving or declining? That question requires an internal baseline — a measurement of your own organization’s behavior over time, built from your own data. Not an external average. Not an industry report. Your data. Your trajectory.
Without that internal reference point, every report you produce is a snapshot floating in space. There is no before. There is no after. There is no direction of travel.
Compass vs. Bearing: Knowing Where You Are Actually Heading
There is a useful distinction from navigation that applies directly here. A compass shows you where you want to go. A bearing shows you where you are going.
Most security tools give you a compass. They set a target — an industry benchmark, a maturity score, a compliance threshold — and tell you whether you are above or below it. That is useful for goal-setting, perhaps. It is not useful for understanding whether your day-to-day reality is moving in the right direction.
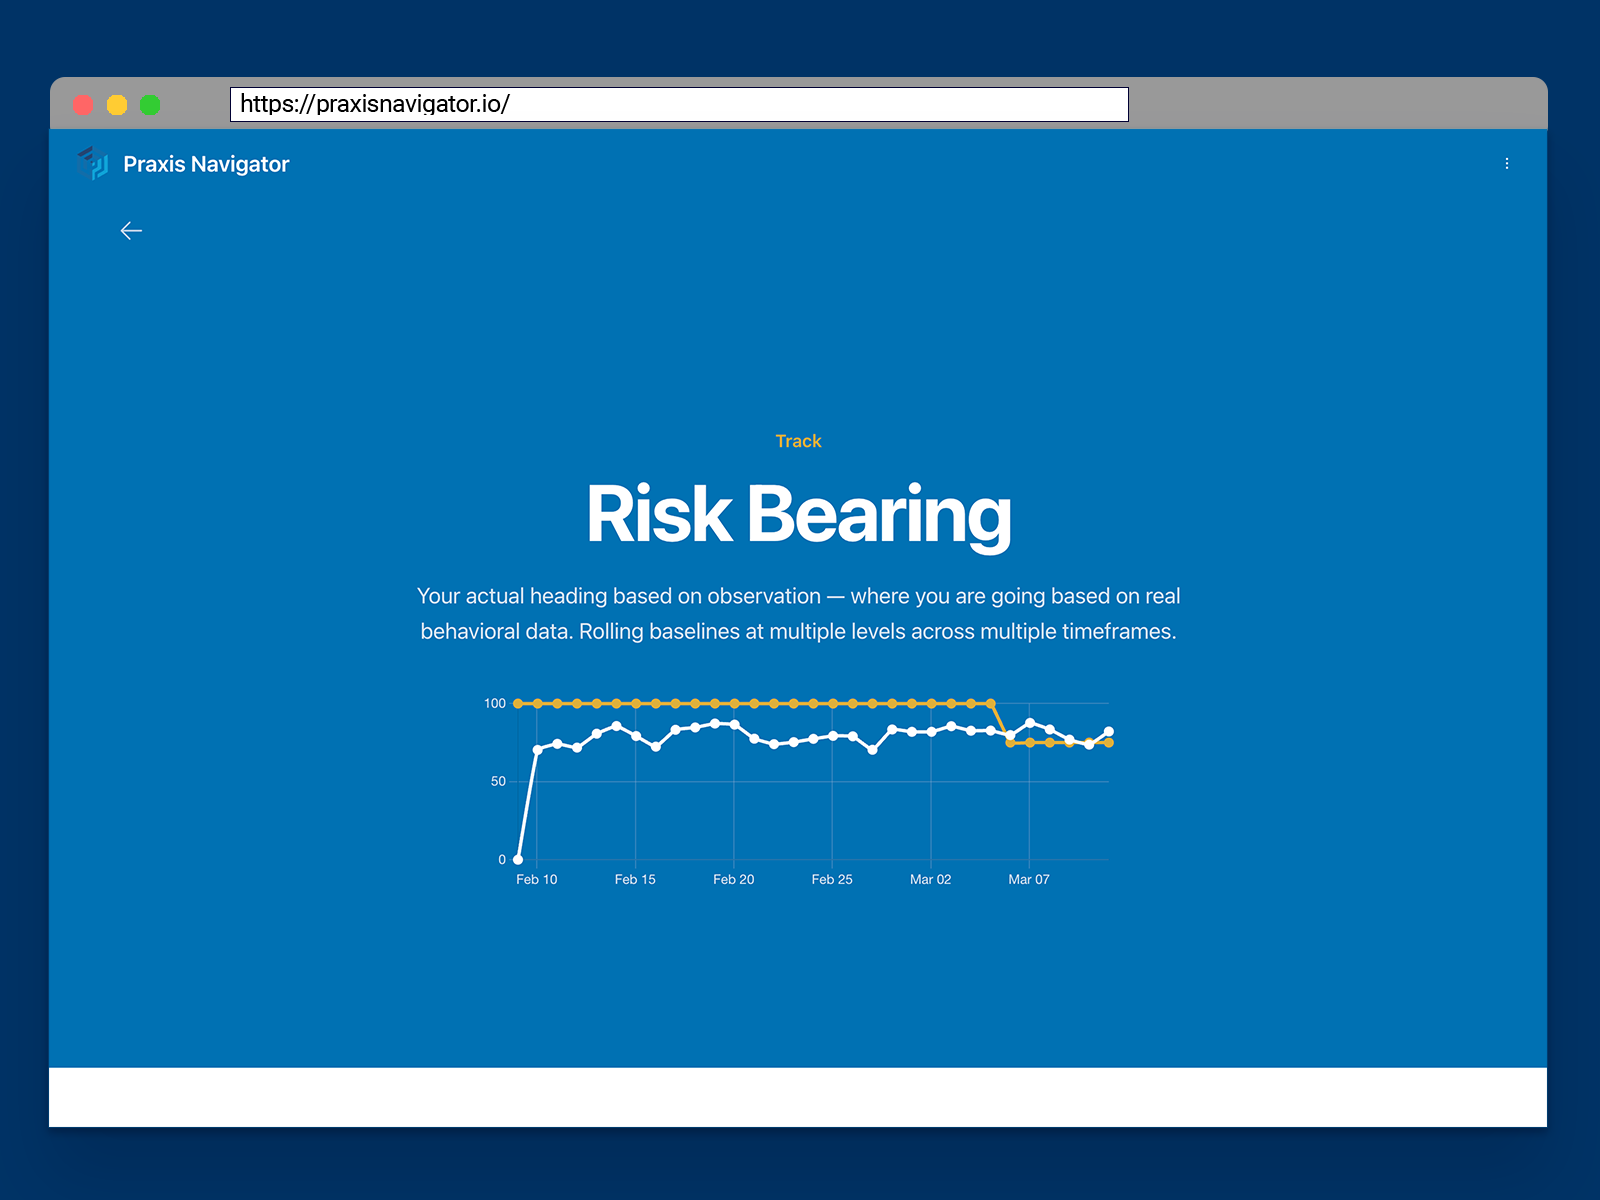
A bearing is different. A bearing is calculated from observation. It is your actual heading based on real data, in the present tense. Not where you planned to go. Where you are going right now.
That distinction is the reason we named this module Risk Bearing. It does not tell you where you should be. It tells you where you are — and whether the direction is changing.
Risk Bearing: Your True Direction of Travel
Risk Bearing builds rolling internal baselines at multiple levels of your organization. Individual users, teams, departments, and the organization as a whole each have their own behavioral baseline. These baselines operate across four timeframes simultaneously: 7-day, 30-day, quarterly, and annual.
What makes this genuinely different is how it starts. When you connect Praxis Navigator to your Microsoft 365 environment, Risk Bearing does not present an empty chart and ask you to wait 30 days for data to accumulate. It builds your initial baselines from the historic behavioral data already sitting in your Microsoft environment. On day one, you have a meaningful baseline. On day two, new data starts layering on top of it.
Previous baselines are preserved as new ones form. This means you are not just tracking current behavior — you are building a history of how your baselines themselves change over time. You can see whether the 30-day trend shifted after a policy change. You can see whether a quarterly baseline held steady even as the 7-day numbers fluctuated. You can distinguish between a temporary disruption and a genuine trajectory shift.
That is the difference between a snapshot and a direction of travel.
What Trending Actually Looks Like
Consider a practical example. A manufacturing company rolls out a new email handling policy in January. The 7-day baseline shows an immediate behavioral shift — fewer employees forwarding internal documents externally, more consistent use of approved sharing channels.
Two weeks later, the 7-day numbers start creeping back toward pre-policy levels. Without Risk Bearing, the IT manager might not notice this regression for months — if they notice it at all. With Risk Bearing, they can see the 7-day trend softening while the 30-day baseline still reflects the overall improvement. They know the policy worked initially, and they know the effect is fading. They can act before the gains disappear entirely.
Contrast this with the old approach: run a policy change, wait until the next quarterly review, compare against an external benchmark that has nothing to do with your organization, and hope the numbers look better. That is not measurement. That is hope.
Risk Bearing replaces hope with observation. You do not need to guess whether things are improving. You can see it — at every level, across every timeframe, updated daily.
Baselines Power the Entire Loop
In our previous post, we introduced Employee Pulse — the live reading of what is happening across your organization right now. Employee Pulse answers the question “what are our people doing?” Risk Bearing answers the follow-up: “is it getting better or worse?”
These baselines also power what comes next. When you make an intervention — a training program, a policy change, a new tool deployment — you need to know whether it actually changed behavior. That requires a before-and-after comparison. Without a reliable baseline, there is no “before” to compare against.
Impact Proof, which we will cover later in this series, uses Risk Bearing’s baselines to provide exactly that evidence. The loop is straightforward: establish a baseline, make an intervention, compare the results, prove what worked.
None of that is possible without a reliable internal baseline. Risk Bearing is the engine that makes the entire measurement loop work.
Your Baseline Starts Richer Today Than It Will Tomorrow
There is one more dimension worth understanding. Microsoft retains behavioral data for a limited period — typically 90 to 160 days depending on your plan. Every week that passes is a week of historic data that ages out permanently.
A customer who connects Praxis Navigator today gets a richer initial baseline than one who connects next month. The data is there right now. It will not be there forever.
Ready to measure your security culture?
Connect your Microsoft 365 and see months of employee security behavior data in 15 minutes. Free 30-day trial.
Start Free Trial